Intro
For some background, I am working on a side project where the tech stack is:
| Category | Component |
|---|---|
| Backend | Axum |
| Backend | rusqlite |
| Backend | sqlite |
| Frontend | remix |
| Frontend | shadCn |
| For now I am using sqlite as my database until I add MySQL and treat sqlite as the cache. |
I’ve configured sqlite to use wal mode because of the following ref:
WAL provides more concurrency as readers do not block writers and a writer does not block readers. Reading and writing can proceed concurrently.In my naive approach, I created a state like the following:
struct AppState {
    cache: Arc<Mutex<Cache>>,
}
And for each route I would lock for each read and write like the following:
pub async fn create_thing(
    State(state): State<AppState>,
    Json(thing): Json<CreateThingRequest>,
) -> Result<String, CreateThingError> {
  let cache = state.cache.lock().await;

  cache
      .insert_thing(thing.into())
      .map_err(|e| {})
}

// ......

pub async fn get_thing(
    State(state): State<AppState>,
    Path(id): Path<String>,
) -> Result<String, CreateThingError> {
let cache = state.cache.lock().await;

let thing = cache

    .get_thing(&id)
    .map_err(|e| {})
}
The issue with this naive approach of adding a lock for each read and write is that I am limiting one database operation at a time. Meaning if I have 10 requests for a read, they must be done one at a time and I’d assume sequentially.
This is suboptimal as I should allow for multiple simultaneous read operations as its not
mutating data that could pose a conflict. And since I have wal mode enabled, I’d think I wouldn’t need
to impose this lock() pattern for each sqlite operation, since it would be unnecessary from my interpretation of the docs
because the concurrency and blocking is handled on a database level. So adding another blocking mechanism on the application layer
seems like overkill and will decrease the overall performance.
A quick solution I though would be to use a read-write lock on the rusqlite connection:
This way multiple readers can access the connection simultaneous and access to one writer.
struct AppState{
  conn: Arc<rusqlite::Connection>
}

fn main()-> Result<(),Box<dyn::std::Error>>{
    let state = AppState {
        conn: Arc<RwLock<rusqlite::Connection>>
    };
}
But you can’t because:
RefCell<rusqlite::inner_connection::InnerConnection>cannot be shared between threads safely withinConnection, the traitSyncis not implemented forRefCell<rusqlite::inner_connection::InnerConnection>if you want to do aliasing and mutation between multiple threads, usestd::sync::RwLockinstead required forArc<Connection>to implementSend
Connection Pool
After some quick searching, I found that I can use r2d2_sqlite crate, where
I will have a pool of connections to enable parallelism with simultaneous requests. This should be good enough and I shouldn’t need
a writer block because sqlite only allows for one writer (at least from what I skimmed online and in the sqlite docs) so adding a block is unnecessary. When I add MySQL, thats when I need to be concerned
about multiple writers since it supports parallel inserts into the same table.
It was an easy add:
// main.rs
#[derive(Clone)]
struct AppState {
    cache: Arc<CacheConfig>,
}

// cache.rs

/*
https://github.com/brettwooldridge/HikariCP/wiki/About-Pool-Sizing
connections = ((core_count * 2) + effective_spindle_count)
*/
const MAX_CONNECTIONS: u32 = 4;
pub struct CacheConfig {
    pool: Pool<SqliteConnectionManager>,
}

impl CacheConfig {
    fn configure_pool(db_path: &str) -> Pool<SqliteConnectionManager> {
        let manager = SqliteConnectionManager::file(db_path);
        Pool::builder()
            .max_size(MAX_CONNECTIONS)
            .build(manager)
            .unwrap_or_else(|e| {
                error!("Failed to configure connection pool: {}", e);
                panic!("Pool not configured");
            })
    }
  // ...
}
And then switch all my queries using the connecting to get a pool connection and then execute:
-        stmt = self
-            .conn
+        stmt = pool
+            .get()?
+            .prepare(
+                "SELECT * FROM
Results
For benchmarking, I went with wrk, a simple CLI tool for http benchmarking. This approach is admittedly the easy way out, and likely not the best way to capture the performance of my sqlite database but my API is essentially a wrapper of writing and fetching from the database. We can still get some takeways if the pooled connections improved performance overall.
Before using sqlite pool on my 2 vcpu server in Hetzner:
❯ wrk -t4 -c100 -d10s \
  -H "accept: text/plain" \
  https://test-server.com/thing/0a27ea9d-964a-4eea-a1f9-3d0c049ad973

Running 10s test @ https://test-server.com/thing/0a27ea9d-964a-4eea-a1f9-3d0c049ad973
  4 threads and 100 connections
  Thread Stats   Avg      Stdev     Max   +/- Stdev
    Latency    48.83ms   50.18ms 540.68ms   96.15%
    Req/Sec   612.14    123.49   800.00     81.72%
  23607 requests in 10.03s, 84.81MB read
Requests/sec:   2353.80
Transfer/sec:      8.46MB
Testing locally on my 2021 macbook pro
sysctl -a | grep cpu
hw.activecpu: 8❯ wrk -t4 -c100 -d10s \
-H "accept: text/plain" \
http://localhost:8080/thing/3ec05a57-ef02-4241-8dd5-12d6ccd37c5a
Running 10s test @ http://localhost:8080/thing/3ec05a57-ef02-4241-8dd5-12d6ccd37c5a
4 threads and 100 connections
Thread Stats Avg Stdev Max +/- Stdev
Latency 11.00ms 2.35ms 48.90ms 96.32%
Req/Sec 2.30k 217.71 2.45k 92.25%
91602 requests in 10.01s, 287.93MB read
Requests/sec: 9150.67
Transfer/sec: 28.76MBAfter updating to pool of connections
2 vCPU Server with pool of 4 connections:
❯ wrk -t4 -c100 -d10s \
  -H "accept: text/plain" \
  https://test-server.com/thing/0a27ea9d-964a-4eea-a1f9-3d0c049ad973

Running 10s test @ https://test-server.com/thing/0a27ea9d-964a-4eea-a1f9-3d0c049ad973
  4 threads and 100 connections
  Thread Stats   Avg      Stdev     Max   +/- Stdev
    Latency    57.08ms   72.66ms 632.56ms   95.54%
    Req/Sec   582.25    127.04   800.00     75.46%
  22172 requests in 10.09s, 79.64MB read
Requests/sec:   2197.00
Transfer/sec:      7.89MB
Local macbook pro with pool of 4:
❯ wrk -t4 -c100 -d10s \
  -H "accept: text/plain" \
  http://localhost:8080/thing/3ec05a57-ef02-4241-8dd5-12d6ccd37c5a
Running 10s test @ http://localhost:8080/thing/3ec05a57-ef02-4241-8dd5-12d6ccd37c5a
  4 threads and 100 connections
  Thread Stats   Avg      Stdev     Max   +/- Stdev
    Latency     6.02ms    8.28ms 120.77ms   95.03%
    Req/Sec     5.36k     1.64k    7.95k    75.50%
  213465 requests in 10.01s, 670.99MB read
Requests/sec:  21316.27
Transfer/sec: 67.00MB| Environment | Database Setup | Avg Latency | Requests/sec | Transfer/sec |
|---|---|---|---|---|
| 2 vCPU Server | Before Pool | 48.83ms | 2353.80 | 8.46MB |
| Local Macbook Pro | Before Pool | 11.00ms | 9150.67 | 28.76MB |
| 2 vCPU Server | After Pool (4) | 57.08ms | 2197.00 | 7.89MB |
| Local Macbook Pro | After Pool (4) | 6.02ms | 21316.27 | 67.00MB |
Conclusion
We see that using the pooled connections significantly improved the requests per second. From 9,150 requests/second to 21,316 requests/second on my local macbook.
But we see that there was actually a regression in performance for the 2 vCPU server. From 2,353 requests/second to 2,197 requests/second.
At first I was surprised to see a regression, but when I checked the CPU utilization percentage when the tests were running, I observed a nearly 92% CPU utilization.
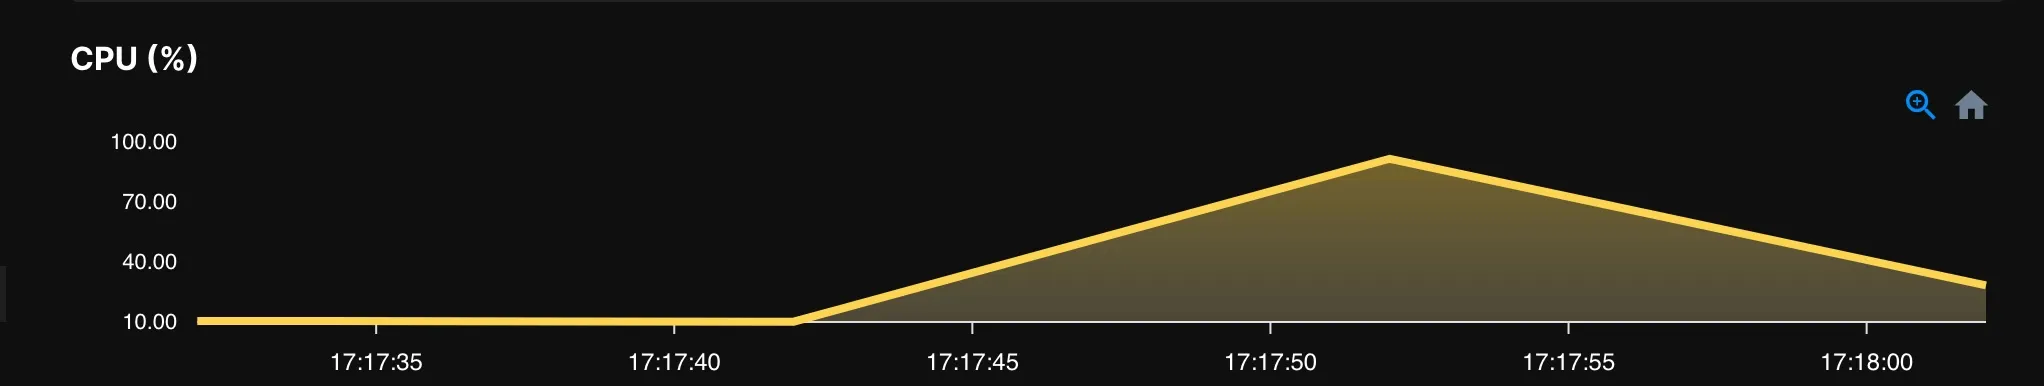 This tells us that we are not benefiting from the extra parallelism because the CPU is the limiting factor of how much work can be done.
Whereas my 8 core machine greatly benefits from having multiple connections.
This tells us that we are not benefiting from the extra parallelism because the CPU is the limiting factor of how much work can be done.
Whereas my 8 core machine greatly benefits from having multiple connections.
It will be fun to experiment further, I’ll likely play with adding an in-memory cache, play with the WAL to see how to read it and use it, optimize the queries…